System Dynamics Insights
Content
The Applications
System Dynamics provide valuable insights connected to future long-term goals. This is achieved by displaying patterns and trends of system and process behaviour. Applications of System Dynamics are found in multiple areas, inlcuding Process Change Management, Product Development Planning, and Project Management. Examples for applications are outlined below.
- Management of Supply Chains
Supply Chain Management allow companies to react to changing business environment by providing the right product at the right time with the right quantities to satisfy customer demand. Among other factors, effectiveness of supply chains is dependent on demand uncertainty and short product life cycle. Reducing instability in the supply chain and sharing information timely with all partners involved in the chain is therefore crucial to maintain profitability. A continuous evaluation of policy is key for anticipating and solving inventory problems. Simulation based on System Dynamics allows to test different scenarios for analyzing and improving inventory systems and to support decisions on policy updates. - Production Processes
Strategic Planning is a process applied in companies to adapt their decision making to future uncertainties. Strategic management therefore helps companies to form a vision and to select the right strategy. Different techniques are at disposal to support managers in their decision making. For example, System Dynamics can be used to simulate behavioural pattern in R&D development and supply chain management. In addition, hybrid approaches enable integration of multiple techniques such as System Dynamics for simulating aggregate system behaviour, Discrete Event Simulation for simulating operational processes and Agent Based Modelling for simulating how customers interact to make purchase decisions.
- Business Process Change
Companies and their Business Processes continously face changes over time. Competitive advantages must be defended against other innovative companies and strategies must be developed to respond to drifts in customer demand. Improving organizational business processes to increase flexibility and enhance performance is therefore a key requirement for companies. System Dynamics is capable a method for Change Managment simulation, not at least by providing insights into feedback processes that determine the behaviour of changed processes. The outcome of any successful Business Process Change is rendered by accomplishing the targeted improvement in process performance, if required facilitated by a drastic change of the underling process.
- Project Management
The management of projects with high complexity and uncertainty can benedfit from the application of System Dynamics. System Dynamics provices a framework for exploring scenarios of dynamic behaviour encountered over the life span of projects. Consideration given to re-work cycles can be integrated into the System Dynamics model to faciliate further insight into delays and project overruns. Root causes in overrun of schedule and projected costs when compared to the original planning can be examined. Simulation by System Dynamics can make transparent the multiple feedback processes and non-linear relationships that are characteristical for complex projects. In Product Development, System Dynamics models for simulating product development processes are concerned with allocation of resources to perform product development tasks and the effects of these allocations on quality, project time and development cost. From a managerial perspective, identifying the critical factors is increasingly more challenging as markets change and competitiveness between companies rises. A useful System Dynamics model is designed to represent the product development process in terms of its stages with alignment to Quality Assurance frameworks such as QS 9000 manual. As a result of analysing the project dynamics various critical factors, e.g. experience of staff, time spent on re-work, technologies used, that influence the timing can be concluded.
The Approach
The System Dynamics approach was developed in the mid 1950s as a method for analyzing complex dynamical systems, with the aim to better understand how and when systems and policies produce an unexpected and undesirable outcome. The usefulness of the System Dynamics approach is the conceptualizaton of a model that can be used for decision making in various areas including business and policy simulation, project management, product development and risk management.
In System Dynamics, a system is modelled as a combination of stocks and flows, with flows representing the rate of changes that lead to continious state changes in the modelled system variables. The underlying equations used to solve the model are difference equations which represent the discrete time dynamics of underlying differential equations.
The stock variables are typically defined as a result of the qualitative modeling and the grapical design based on stock-flow diagramms. For a system to model its behaviour the flow in and out of the stocks require quantification. Quantification is achieved through definition of rate changes linked together via differential equations. Integration over rate changes is based on the defining differential equations and takes the form
\[Stock Level _{t} =Stock Level _{t-\Delta t} +\Delta t \cdot (Inflow Rate_{t-\Delta t} - Outflow Rate_{t-\Delta t} )\]
System Dynamics is successfully applied to solve problems in multiple areas. Typically multiple sources of information are used, including numerical data and interviews, to elicit the core information required for modelling a complex system. The advantages of using System Dynamics in Project Management are demonstrated below, but the same benefical features apply to uses in other areas as well.
System Dynamics models are capable to transparently exposee key behavioural characteristics in processes and systems.
- Multiple dependencies among system components are well captured by System Dynamics models and promote transparency about tracing the causal impact of changes throughout the system.
- Systems exhibit a different behaviour over time. Perturbations to systems for instance cause short-run responses that converge to long-run response after any impact of delays.
- Large numbers of feedback relationships for balancing or re-inforcing are a common characterics shown. Tools such as GANTT charts will not solve or even exhibit the impact caused by multiple feedback processes. The System Dynamics approach by comparison is conceptually capbable to incorporate feedback loops and to forecast any impact.
- Nonlinearity observed in large systems leads to non-proportinal relationships between causes and effects.System Dynamics model incorporate and project non-linear behaviour in the model formulation.
Demonstration of the Logistic Growth Model
Ordinary Differential Equations (ODE) are useful in describing growth phenomena in multiple areas. The logistic equation describes a growth pattern that is commonly observed in a context where competing forces and saturation effects lead to limitations in growth.
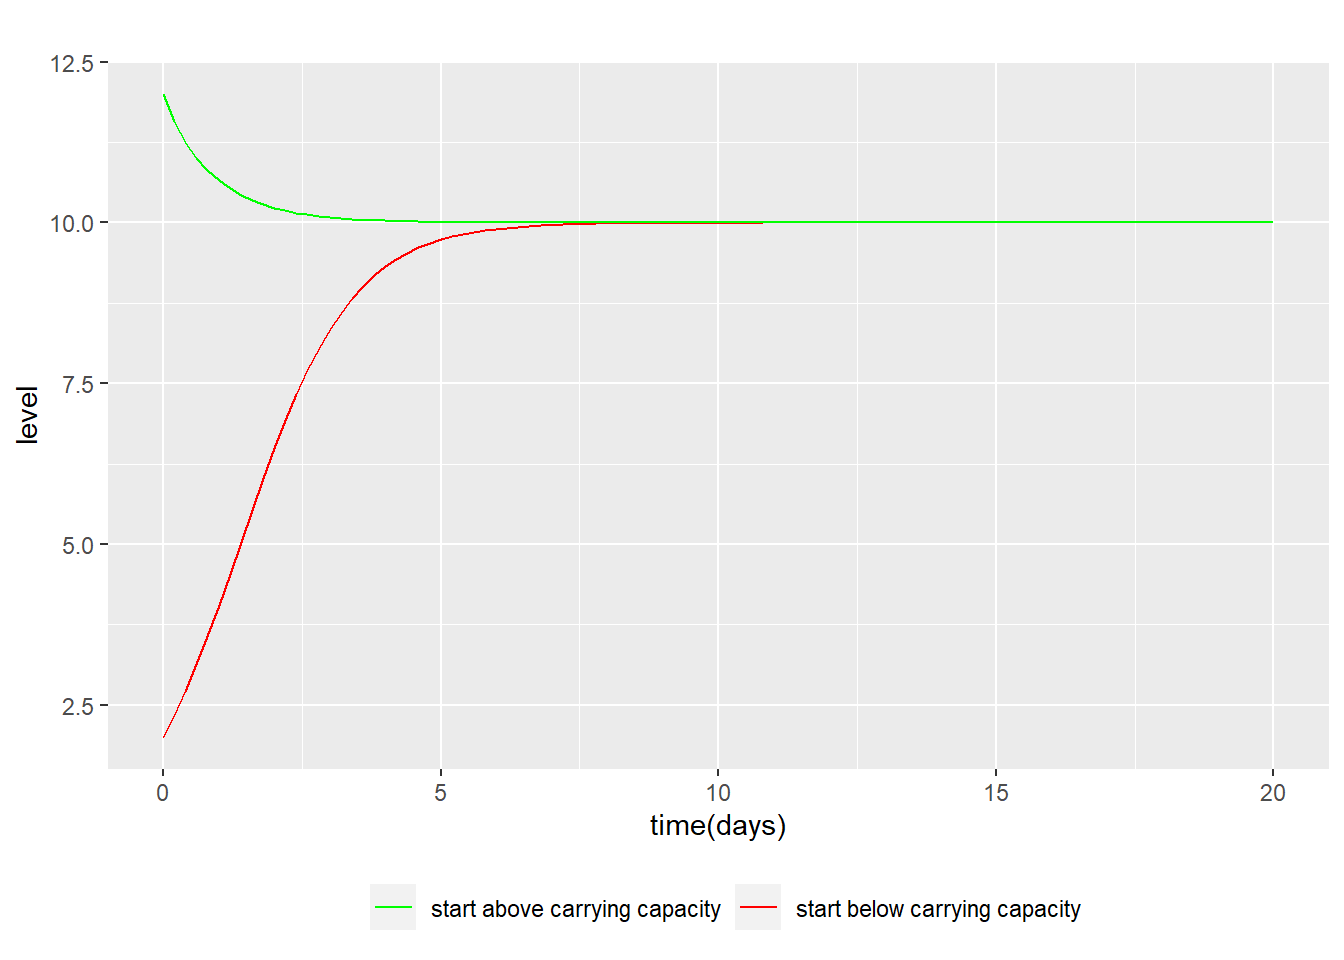
To illustrate, consider the growth of company revenues from selling a product until market saturation takes place. For a variable of interest y, its growth is limited by a carrying capacity. Specifically, growth is reduced with higher levels of y due to competing forces that pull the levels towards the carrying capacity. As a result, growth is initially exponential at a growth rate r. However, with increasing levels of y the growth turns negative above a carrying capacity K. The logistic ODE describing this phenomenon is written as.
\[\normalsize \frac{d\,y}{d\,t} = r \cdot y \cdot (1-\frac{y}{K})\]
Considering two solutions to the logistic equation, each for an initial condition specified by \(y(0)=2\) and \(y=12\). Parameters are specified as \(r=1\) and \(K=10\). Displayed below are two solutions to the logistic equation. For each initial condition the matching solution is shown.


